


August 20, 2012
CER President Jeanne Allen explains why CER is Taking America Back to School on Education Reform.
Updated as of December 2019
1) SNAPSHOT OF U.S. STUDENT ACHIEVEMENT
2) SCHOOLS
3) ENROLLMENT
4) TEACHERS
6) EXPENDITURES
8) FUNDING
Snapshot of U.S. Student Achievement:
NATION’S REPORT CARD:
Scores from the most recent National Assessment of Educational Progress (NAEP), better known as the Nation’s Report Card:
(National Assessment of Educational Progress, 2019)
ACT:
On the ACT, 36% test takers did not meet any of the four benchmarks. The percentages of graduates meeting the ACT College Readiness Benchmarks in math and English are the lowest they’ve been in 15 years.
(The Condition of College and Career Readiness 2019)
ACHIEVEMENT GAP:
Scores at or above proficient among subgroups:
(National Assessment of Educational Progress, 2019)
HOW U.S. STUDENTS COMPARE INTERNATIONALLY:
According to the Program for International Student Assessment (PISA), out of 34 countries, the U.S. ranks:
1 out of 5 of American 15-year-olds scored so low on the PISA test that it appeared they had not mastered reading skills expected of a 10-year-old. The U.S. spends more per student than other countries on education, but that spending does not translate into better performance.
(Program for International Student Assessment, 2018)
TOTAL NUMBER OF PUBLIC SCHOOL DISTRICTS: approx. 13,600
PERCENTAGE OF STATES WITH ELECTED SUPERINTENDENTS (versus appointed or recommended): 26%
(Education Commission of the States: 2017)
TOTAL NUMBER OF PUBLIC SCHOOLS: 98,277
(Digest of Educational Statistics: 2017, Table 105.50 )
TOTAL NUMBER OF CHARTER SCHOOLS: 7,000
(The National Alliance of Public Charter Schools: 2018)
TOTAL NUMBER OF PRIVATE SCHOOLS: 32,461
(Private School Universe Survey: 2017-2018, Table 1 )
TOTAL NUMBER OF CATHOLIC SCHOOLS: 6,289
(NCEA The Annual Statistical Report on Schools, Enrollment, and Staffing: 2019)
TOTAL K-12 ENROLLMENT: 56,600,000
TOTAL PUBLIC SCHOOL ENROLLMENT: 50,800,000
TOTAL CHARTER SCHOOL ENROLLMENT: 3,200,000
(The National Alliance of Public Charter Schools)
TOTAL PRIVATE SCHOOL ENROLLMENT: 4,898,154
(Private School Universe Survey: 2017-2018, Table 1 )
TOTAL HOME SCHOOL ENROLLMENT:1,642,027 or 2.56% of America’s school population
(HomeSchoolConnect:2017-2018 )
TOTAL CATHOLIC SCHOOL ENROLLMENT: 1,789,363
(NCEA The Annual Statistical Report on Schools, Enrollment, and Staffing: 2019)
TOTAL FULL TIME ONLINE SCHOOL ENROLLMENT: 297,712 Students
TOTAL BLENDED LEARNING ENROLLMENT: 132,960 Students
(National Education Policy Center: 2019)
Teachers:
TOTAL PUBLIC SCHOOL TEACHERS: 3,200,000
(Fast Facts: Teacher Trends 2017)
TOTAL CHARTER SCHOOL TEACHERS: 218,000
(Digest of Educational Statistics: 2017, Table 209.21)
TOTAL PRIVATE SCHOOL TEACHERS: 491,000
(Digest of Educational Statistics: 2017, Table 208.20)
TOTAL CATHOLIC SCHOOL TEACHERS: 146,620
(National Catholic Education Association, 2018)
PUBLIC SCHOOL STUDENT-TEACHER RATIO: 16.1:1
PRIVATE SCHOOL STUDENT-TEACHER RATIO: 12.2:1
(Digest of Educational Statistics: 2017, Table 208.20)
CATHOLIC SCHOOL STUDENT-TEACHER RATIO: 12:1
(National Catholic Education Association, 2018)
TOTAL PUBLIC SCHOOL EXPENDITURES: 705,558,501,000
(Digest of Educational Statistics: 2018, Table 236.10)
AVERAGE DISTRICT PUBLIC SCHOOL PER PUPIL EXPENDITURE: $12,201
AVERAGE PUBLIC CHARTER SCHOOL PER PUPIL EXPENDITURE: $7,131
(The Center for Education Reform, Survey of American Charter Schools: 2014)
AVERAGE CATHOLIC SCHOOL PER PUPIL EXPENDITURE
(National Catholic Education Association, 2018 )
AVERAGE PRIVATE SCHOOL TUITION: $10,676
(Private School Review: 2019-2020)
AVERAGE CATHOLIC SCHOOL TUITION:
(National Catholic Education Association, 2018 )
PUBLIC SCHOOL ADMINISTRATORS:
(Bureau of Labor Statistics, Occupational Outlook Handbook: 2018)
SCHOOL PRINCIPALS:
(Bureau of Labor Statistics, Occupational Outlook Handbook: 2018)
PUBLIC SCHOOL PROFESSIONAL PERSONNEL:
(Bureau of Labor Statistics, Occupational Outlook Handbook: 2018)
AVERAGE TEACHER BASE SALARY:
(Bureau of Labor Statistics, Occupational Outlook Handbook: 2018)
PUBLIC SCHOOL SUPPORT STAFF SALARIES:
(Bureau of Labor Statistics, Occupational Outlook Handbook: 2018)
HOURLY WAGE RATES:
(Bureau of Labor Statistics, Occupational Outlook Handbook: 2018)
TOTAL FUNDING OF PUBLIC EDUCATION: 664 Billion
(Digest of Education Statistics: Public School Revenue Sources, 2018)
The following are answers to some frequently asked questions (FAQs) regarding school choice and what choice means for students, parents, educators, schools and communities. The answers to these FAQs are intended to provide only an introductory overview of key school choice issues. Links with additional information are provided for those who are interested in learning more.
What Does School Choice Mean?
 The term “school choice” means giving parents the power and opportunity to choose the schools their children attend. Traditionally, children are assigned to a public school according to where they live. People of greater economic means already have school choice, because they can afford to move to an area with high quality public schools, or to enroll their children in private schools. Parents without such means, until recently, generally had no school choices, and had to send their children to the schools assigned to them by the district, regardless of the schools’ quality or appropriateness for their children.
School choice creates better educational opportunities for all students, because it uses the dynamics of consumer opportunity and provider competition to drive service quality. This principle can be found anywhere you look, from cars to colleges, but it’s largely absent in our public school system and the poor results are evident, especially in the centers of American culture – our cities. School choice programs foster parental involvement and high expectations by giving parents the option to educate their children as they see fit. It reasserts the rights of parents and the best interests of children over the convenience of the system, infuses accountability and quality into the system, and provides educational opportunity where none existed before.
What Kinds of School Choice Exist Today?
• Full school choice programs, also known as tuition vouchers, provide parents with a portion of the public educational funding allotted for their child to attend school, and allows them to use those funds to send their child to the school of their choice. It gives them the fiscal authority to send their child to the educational institution that best suits their need, whether it is a religious or parochial school, another private school, or a neighborhood or magnet public school. These programs empower the family and, in so doing, infuse consumer accountability into the traditional public school system. Twenty-one voucher programs serve 115,580 students across the country, and several states offer choice scholarship programs specifically for students with special needs.
Access to full school choice programs is often restricted based on geography and income. Although most programs require residency in the district to qualify for vouchers, expanding numbers of statewide programs offer more flexibility. Many programs also have restrictions on income. For instance, the Milwaukee voucher program only offers scholarships to families below 300% of the poverty line.
• Private scholarship programs, locally based and privately funded, also provide opportunities for quality education where none existed before by making the excellence of the private sector available to families of lower socio-economic status. A non-comprehensive list of available private scholarships can be found here.
For more information about and links to voucher and individual scholarship programs, check out School Choice Programs Across the Nation.
• Charter schools are public schools that provide unique educational services to students, or deliver services in ways that the traditional public schools do not offer. They provide an alternative to the cookie-cutter district school model. Charters survive — and succeed — because they operate on the principles of choice, accountability and autonomy not readily found in traditional public schools. (See Just the FAQs – Charter Schools.) Find a charter school and join the nearly 3 million students who have chosen to attend one of the more than 6,500 charter schools in the United States.
• Public School Choice: Forty-six states and DC have adopted public school choice, which allows parents to enroll their children at any public school in a district, or in some cases, in other districts.
• Tuition Tax Credits and Deductions: A number of states offer support of parental school choice through various tax credit or deduction processes. For more information on tax credit scholarship programs visit Tax Credit FAQ.
• Education Savings Accounts (ESAs): A handful of states offer ESAs, which take a child’s state education dollars and create an individual education account that parents can use as they see fit to cover private school tuition, textbooks, tutors, or a variety of education-related expenses as deemed applicable by each individual state law. Arizona was the first state to enact an Education Savings Account program.
A Matter of History
Publicly-Sponsored Secular School Choice (2), Maine; Vermont
The longest running, and least controversial, full school choice program is in Vermont. In order to meet the demand of parents who live in towns too small to support a local public school, the state pays the tuition expenses for children to attend any public or non-sectarian private school (including schools outside the state). Vermont’s initial tuition statute, adopted in 1869 to ensure that both urban and rural school children could receive a quality secondary education, did not distinguish between religious and secular schools. In 1961, a court ruling banned religious schools from participating. The citizens and school board of Chittenden attempted to challenge the ban, but in 1999, the Vermont Supreme Court upheld the ban on religious schools under the Vermont constitution’s “compelled support” clause.
Maine’s tuition system has existed in some form for well over 200 years. During colonial years, and throughout the 18th and 19th centuries, many towns provided for the education of their residents by paying tuition for students to attend “private tuition schools,” many of which were operated by religious organizations. As the public education system grew, it became apparent that many of the state’s rural towns could not afford to build high schools, and so a tuition system was developed that paid the child’s tuition to any school of the parent’s choosing, in-state or out-of-state. But in 1980, the department of education ruled out religiously affiliated schools in towns that have public high schools, limiting many of the traditional choices for quality education that Maine families once exercised. On April 23, 1999, the Maine Supreme Court ruled that the ban on religious schools is not unconstitutional, but did not say whether the inclusion of religious schools would be unconstitutional. The decision does not support the right of parents to send their children to a religious institution and receive a tuition reimbursement. In November of 2006, the U.S. Supreme Court declined to hear the case.
Do School Choice Programs Work?
 Yes. While most of the programs in question are young, evidence suggests that they provide educational opportunity to those that need it most.
One choice success story comes from the largest and longest running voucher program, the Milwaukee Parental Choice Program. Students in this program tested 9 to 12 percent higher in math, reading and science than their equally disadvantaged peers. Students also graduated at an 18 percent higher rate. The District of Columbia’s Opportunity Scholarship Program (OSP) is another school choice success. A 2010 study from the Institute of Education Sciences found that students who were awarded a scholarship graduated from high school at a 12 percent higher rate than those who applied for the scholarship lottery but did not receive it.
Don’t Choice Programs Just “Cream” the Best Students?
Skeptics often argue that school choice programs only succeed because they “cream” the best students, those with the most involved parents or the best academic talents, and leave the hard-to-educate behind in the troubled traditional public school system. By measurements of student academic progress, parental involvement, constituent satisfaction and public school reaction to competition, the above mentioned studies show that choice programs do not succeed by “creaming,” but by providing quality education to all students. Consider:
• While a third of traditional district public school students nationally are minorities, more than half of charter school students are minorities and 14 percent have identified special needs.
• Established choice scholarship programs in Cleveland and Milwaukee target at-risk children, exclusively from low-income families.
• The older programs in Vermont and Maine provide schooling in rural locations where public schooling was unavailable.
• Private scholarship programs specifically target low-income, at-risk children.
School choice does not “cream;” rather, it allows parents of at-risk children to choose the schooling that best suits their child’s educational and emotional needs, and in many cases parents are able to explore schooling alternatives before their child’s problems become too severe.
Don’t These Programs Just Subsidize the Tuition of Rich People and Leave the Poor Behind?
 School choice programs are aimed at serving those least served by the traditional public school system. The two modern programs in Milwaukee and Cleveland help poor and needy children. In Cleveland, students from low-income families receive larger scholarships. 6,377 students participated in the program in the 2013-14 school year, and vouchers can be worth as much as $4,250 per elementary school student, and $5,700 for students in high school. Priority is determined by family income; the student’s family income must be below 200 percent of the poverty line. Low-income students also have a better chance of winning the initial lottery. Because this lottery received considerable attention by the local press, low-income families were more likely to find out that they had won a scholarship.
In Milwaukee, eligibility is limited to Milwaukee families with incomes at or below 300 percent of the federal poverty level. Though more students are eligible, 24,938 students participated in Milwaukee’s voucher program in the 2013-14 school year, receiving an average voucher of $6,442. The original program’s participation was limited to 1.0 percent of MPS enrollment, but the cap has since been removed.
Research Continues to Show Success and Satisfaction
In Evaluation of the DC Opportunity Scholarship Program: Impacts After Three Years, (March 2009) researchers Patrick Wolf, Babette Gutmann, Michael Puma, Brian Kisida, Lou Rizzo, Nada Eissa, and Marsha Silverbrg, found:
• Across the full sample, there was a statistically significant impact on reading achievement from the offer of a scholarship and from the use of a scholarship. These impacts are equivalent to 3.1 and 3.7 months of additional learning, respectively. However, there was no significant impact on math achievement.
• Parents of students offered a scholarship were more likely to report their child’s school to be safer and have a more orderly school climate compared to parents of students not offered a scholarship.
• The scholarship program had a positive impact on parent satisfaction with their child’s school as measured by the likelihood of grading the school an “A” or “B,” both for the impact of a scholarship offer and the impact of scholarship use.
School choice programs have become more common, especially in 2011, when 13 states passed voucher programs and almost 30 more have legislation pending. Indiana passed a voucher bill that has the broadest base of eligibility of any program to date, with no cap on participation by 2013. Vouchers have shown success and are poised to become more and more common in the coming years.
Voucher programs are expanding, but special education still receives priority: The John M. McKay Scholarships for Students with Disabilities Program, put into statewide practice in 2000, provided vouchers to 27,040 students with disabilities in 2013-14 with a total expenditure of $168,890,916.. These students are most in need and receive more direct assistance.
Are Choice Scholarships Programs Constitutional?
 The strongest critics of choice scholarship programs claim that they violate the First Amendment (establishment of religion) if dollars are used for religiously affiliated schools. The First Amendment provides freedom of religion, not freedom from religion. Choice scholarship programs let parents choose where to direct their children’s education funds. The state is not imposing religion upon its citizens (a concern of the Founding Fathers), nor does offering parents the choice of a religious education for their children substantiate federal funding of religious institutions. As Clint Bolick, Vice President for Litigation at the Goldwater Institute observes:
All credible contemporary school choice proposals are constitutional.[Contemporary school choice programs] do not propose subsidizing religious schools, but merely include such schools within the range of educational options made available to a neutrally defined category of beneficiaries (usually economically disadvantaged families). No public funds are transmitted to religious schools except by the independent decisions of third parties. As the U.S. Supreme Court repeatedly has affirmed, such “attenuated financial benefit[s], ultimately controlled by the private choices of individual[s]“…are simply not within the contemplation of the Establishment Clause’s broad prohibition.
In 2002, the U.S. Supreme Court upheld the constitutionality of the Cleveland, Ohio school choice program, ensuring that laws returning parental stewardship of state educational funds for their children will not be overturned at the federal level.
Wouldn’t it Be Better To Put More Money Into the Existing School System Instead?
The “money issue” is politically charged and requires careful consideration and clarification. Many fiscal issues, from labor contracts to program mandates, are more a function of larger systemic barriers than of money, so increasing or tinkering with funding will likely do nothing to resolve perpetually mediocre education systems. In the last few decades, spending on K-12 public education has grown substantially without improving academic achievement. Expenditures have increased from $162 billion in 1982 to nearly $543 billion in the 2009-10 school year. The United States spent a higher percentage of its GDP on education than Italy, France Hong Kong, Canada, the Netherlands, or the UK in 2007 (the last year that official data is available).
Meanwhile, national indicators of academic progress have been disappointing. National Assessment of Education Progress (NAEP) scores have shown little overall improvement for students aged 17 since 1971. According to the 2012 PISA report, students in the U.S. scored only in the “average” category in reading, below countries like Finland, Canada, Japan, and Poland. In science categories, the U.S. is trailing Slovenia. Twenty-seven countries outperformed the U.S. in science literacy. Thirty-five jurisdictions outperformed the U.S. in mathematics. Twenty-three jurisdictions outperformed the U.S. in reading. Eighteen countries outperformed the U.S. in all three subjects. While money is important, America’s educational performance over the last few decades shows that “more money” is not the solution to our nation’s educational problems.
Some call it “school choice”, but it’s really about educational opportunity– and giving parents the power to choose the schools their children attend. Traditionally, children are assigned to a public school according to where they live. People of greater economic means already have school choice, because they can afford to move to an area with high-quality public schools or to enroll their children in private schools. Parents without such means generally do not have the same access to choices and must send their children to the schools assigned to them by the district, regardless of the school’s quality or appropriateness for their children.
Do School Choice Programs Work?
Don’t Choice Programs Just “Cream” the Best Students?
Are Choice Scholarships Programs Constitutional?
John M. Engler is president of the Business Roundtable and a former three-term Michigan Governor. As governor, Engler was committed to improving education, focusing on high standards, more accountability and strengthening local control.
Transparency – John Engler – CER-Mandate-2009
Kevin P. Chavous is a partner at law firm SNR Denton LLP. He is a former member of the DC Council and continues his efforts to bring quality school choice to students by speaking across the country. Kevin is Chairman of Black Alliance for Educational Options. He is co-founder and chair of Democrats for Education Reform.
Richard Whitmire, a veteran newspaper reporter and former editorial writer at USA Today, is the author of the just-published The Bee Eater: Michelle Rhee Takes on the Nation’s Worst School District. He is also the author of Why Boys Fail, which explores why boys are falling behind in K-12 schools. He writes the Why Boys Fail blog for Education Week and comments on urban school reform issues atthebeeeater.com.
Teacher Quality – Richard Whitmire – CER-Mandate-2009
Mobile-Friendly Toolkit Coming Soon!
Print or download your PDF copy of Building Community Support for Education Reform
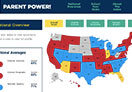
Exercising Parent Power
It’s that time of year again – kids are heading back to school. For parents, this can be a reason to rejoice or panic.
Sure, you’re happy your child is going to begin another year of learning and growth. But, at the same time you may be worried about whether or not your child is in the right environment, if the teachers are properly preparing your child for the future or if there are better options available.
Well, the Center for Education Reform is available to help.
Parent Power provides the tools for parents to become empowered and make the best decisions possible for their child’s future.
Whether you have questions about charter schools, school choice, curriculum, evaluating your child’s school, digital learning, or even how to stay involved and informed with your child’s homework, the site will help you get the answers you need.
Parents have more power over their child’s education than ever before. You just may not realize it. Parent Power will help you navigate the system and take control over your child’s learning.